plot points
Arguments
- data
data.frame contain x, value, and variable
- label_x
x-axis label
- label_y
y-axis label
- colors
color vector
Examples
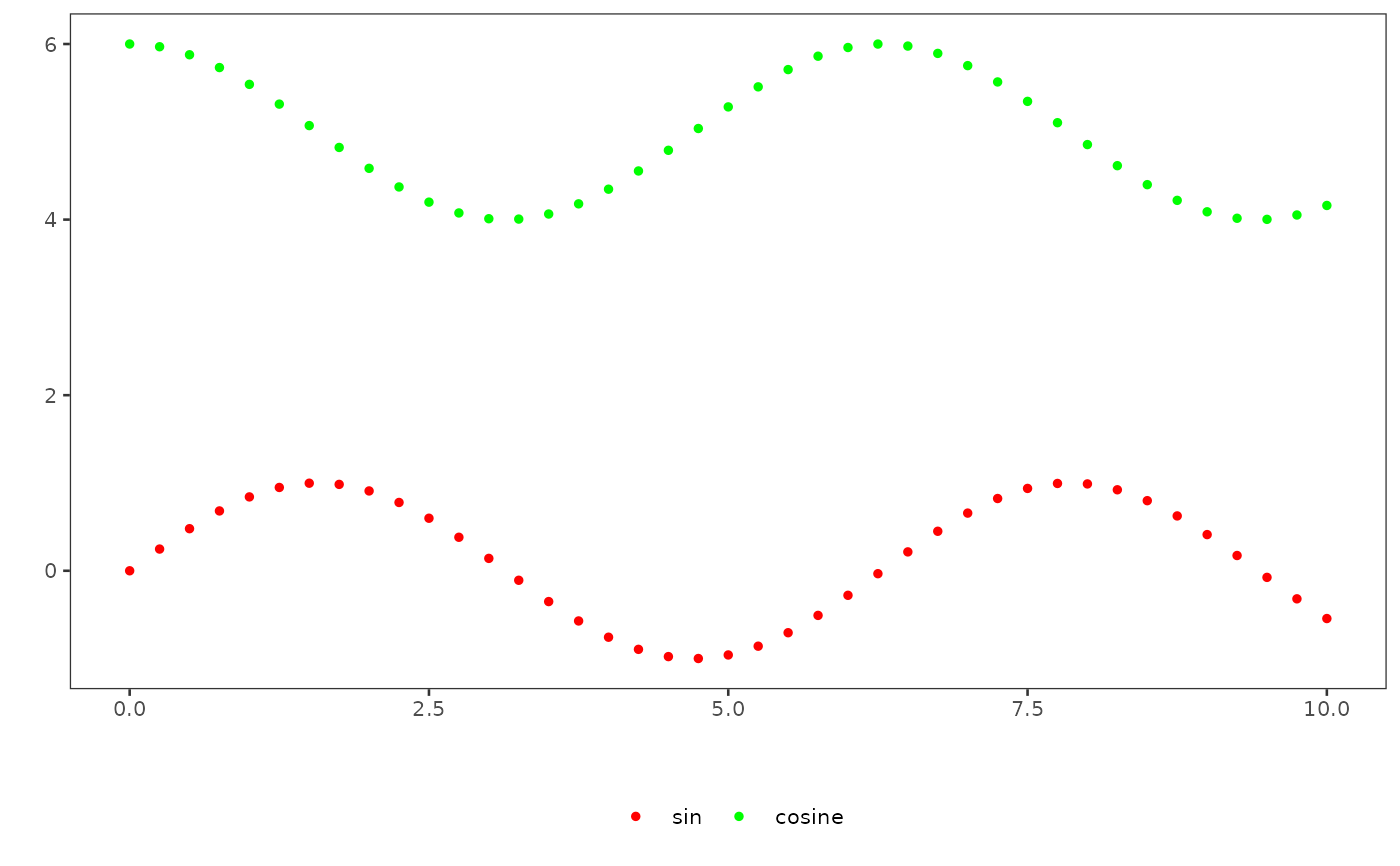
x <- seq(0, 10, 0.25)
data <- data.frame(x, sin=sin(x), cosine=cos(x)+5)
head(data)
#>      x       sin   cosine
#> 1 0.00 0.0000000 6.000000
#> 2 0.25 0.2474040 5.968912
#> 3 0.50 0.4794255 5.877583
#> 4 0.75 0.6816388 5.731689
#> 5 1.00 0.8414710 5.540302
#> 6 1.25 0.9489846 5.315322

grf <- plot_points(data, colors=c("red", "green"))
plot(grf)