Convenience plotting helper for Harbinger detections. It accepts a detector, the input series, an optional detection data frame, and optional ground-truth events to color-code true positives (TP), false positives (FP), and false negatives (FN). It can also mark detected change points and draw reference horizontal lines.
Usage
har_plot(
  obj,
  serie,
  detection = NULL,
  event = NULL,
  mark.cp = TRUE,
  ylim = NULL,
  idx = NULL,
  pointsize = 0.5,
  colors = c("green", "blue", "red", "purple"),
  yline = NULL
)
Arguments
- obj
A
harbingerdetector used to producedetection.- serie
Numeric vector with the time series to plot.
- detection
Optional detection data.frame as returned by
detect().- event
Optional logical vector with ground-truth events (same length as
serie).- mark.cp
Logical; if TRUE, marks detected change points with dashed vertical lines.
- ylim
Optional numeric vector of length 2 for y-axis limits.
- idx
Optional x-axis labels or indices (defaults to
seq_along(serie)).- pointsize
Base point size for observations.
- colors
Character vector of length 4 with colors for TP, FN, FP, and motif segments.
- yline
Optional numeric vector with y values to draw dotted horizontal lines.
References
Ogasawara, E., Salles, R., Porto, F., Pacitti, E. Event Detection in Time Series. 1st ed. Cham: Springer Nature Switzerland, 2025. doi:10.1007/978-3-031-75941-3
Examples
library(daltoolbox)
# Load an example anomaly dataset
data(examples_anomalies)
# Use the simple time series
dataset <- examples_anomalies$simple
head(dataset)
#> serie event
#> 1 1.0000000 FALSE
#> 2 0.9689124 FALSE
#> 3 0.8775826 FALSE
#> 4 0.7316889 FALSE
#> 5 0.5403023 FALSE
#> 6 0.3153224 FALSE
# Set up an ARIMA-based anomaly detector
model <- hanr_arima()
# Fit the detector
model <- fit(model, dataset$serie)
# Run detection
detection <- detect(model, dataset$serie)
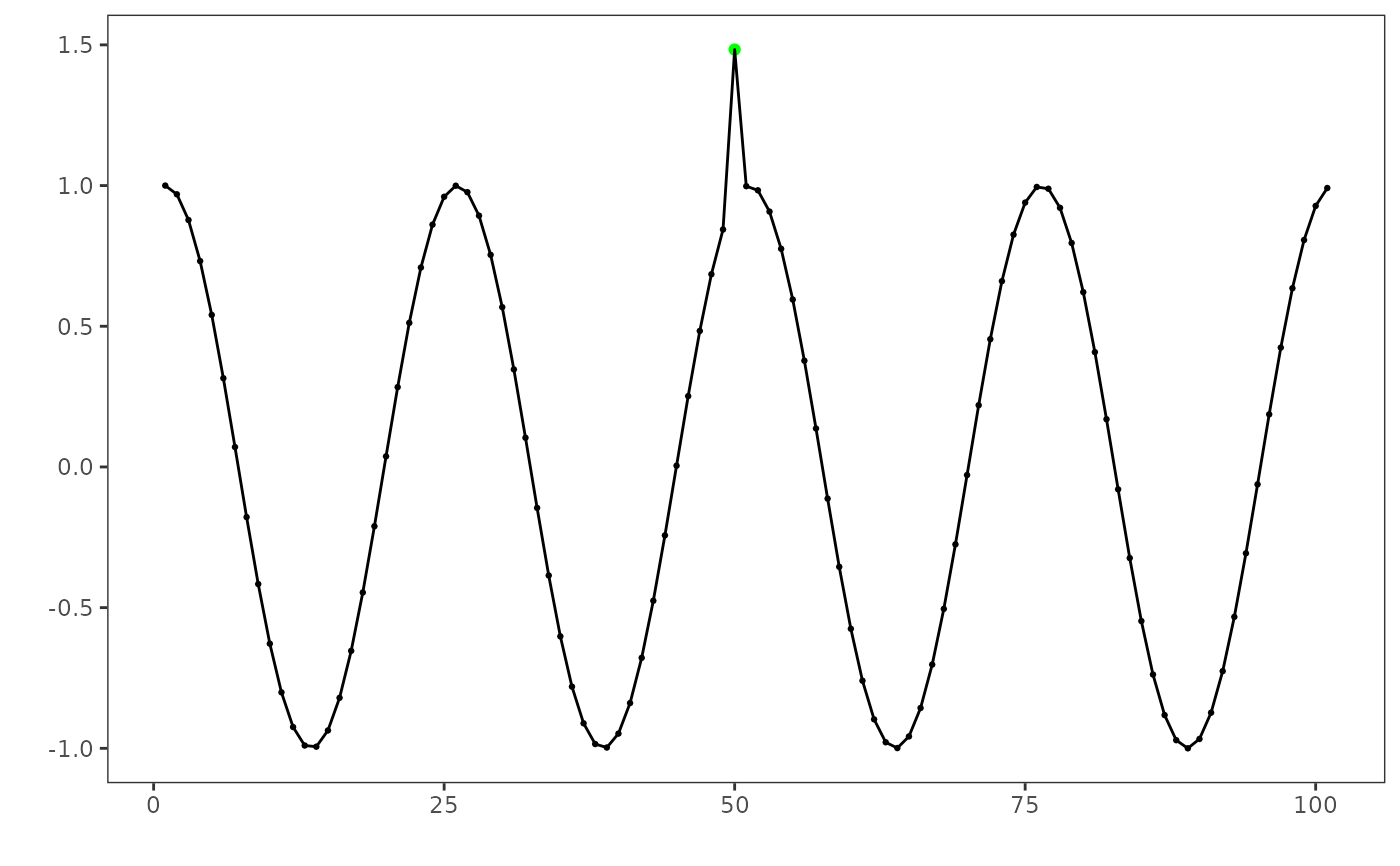
# Inspect detected events
print(detection[(detection$event),])
#> idx event type
#> 50 50 TRUE anomaly
# Evaluate detections (soft evaluation)
evaluation <- evaluate(har_eval_soft(), detection$event, dataset$event)
print(evaluation$confMatrix)
#> event
#> detection TRUE FALSE
#> TRUE 1 0
#> FALSE 0 100
# Plot the results
grf <- har_plot(model, dataset$serie, detection, dataset$event)
plot(grf)